Generate vector tiles with built-in postgis functions
This blog post explores the possibility of generating, caching and serving vector tiles on the fly, from a PostgreSQL database, using built-in PostGIS functions ST_AsMVT and ST_MakeEnvelope.
1. Setup a test database
Let us begin by firing off a db instance. We use docker for this because of its easily reproducible and disposable nature. We also use docker-compose because we want to be able to orchestrate multiple containers such as database, caching and other services. For now, we will get started with a single docker image which gives us a Postgres instance with PostGIS extension installed.
File: docker-compose.yml
version: '3'
services:
  db:
    image: mdillon/postgis
    ports:
      - "5432:5432"
    environment:
      - "POSTGRES_PASSWORD=pass"
Note: The database password here is extremely simple. Make sure you use something more complex if running this code outside of local development environment.
To test the compose file, execute: docker-compose config -q and to fire up the containers, run the command: docker-compose up -d:
2. Import some test data
Now that we’ve a postgres instance up and running, we can begin importing some data.
Create a database and initialize the POSTGIS extension:
docker-compose exec db psql -U postgres -c 'CREATE DATABASE roads'
docker-compose exec db psql -U postgres roads -c 'CREATE EXTENSION POSTGIS'
I exported road data of the Pune city, the city I live in, and hosted it on the github repo:
Download and extract test data [1]:
wget https://github.com/androidfanatic/tiles_with_st_asmvt/raw/master/data/pune_roads.tar.gz
tar -xvf pune_roads.tar.gz
This will extract a GeoJSON file in the current directory. We want to be able to import this data into our database. In comes GDAL. I call it the swiss-knife of GIS data. GDAL allows one to work with GIS datasets of all sizes and formats and offers wide variety of features for data translation. Head over to https://www.gdal.org/ for quick installation steps and to read more about it.
Once installed, we can begin importing the data from the GeoJSON file into our database with this simple one-liner:
ogr2ogr -f "PostgreSQL" PG:"dbname=roads user=postgres host=localhost password=pass" \
  "pune_roads.geojson" -nln pune_roads -append \
  -t_srs "http://spatialreference.org/ref/epsg/4326/" -overwrite
Let’s also verify that the data was imported.
docker-compose exec db psql -U postgres roads -c "SELECT COUNT(*) FROM pune_roads"
Now that we’ve the test database setup with some test data seeded in, let’s work on generting the vector tiles on the fly.
3. Create a tile service
To display the data back, we begin by creating a HTTP service that returns vector tiles. To do so, we use a combination of ST_AsMVT, ST_AsMVTGeom and ST_MakeEnvelope functions provided by PostGIS.
Here’s a NodeJS script, inspired by Chris’s blog post [2]:
The interesting bit here is the translation of /z/x/y parameters to a bounding box that gets consumed by the function ST_MakeEnvelope(). We also set clipping = True for the function ST_AsMVTGeom and select additional database columns (id, name and highway in this case) that get translated to feature properties.
These feature properties can be used for data-driven styling [3], displaying additional information on map and more.
File: app.js
// mercator
const SphericalMercator = require('@mapbox/sphericalmercator');
const mercator = new SphericalMercator({size: 256});

// database library
const {Client} = require('pg')
const db = new Client('postgres://postgres:pass@localhost:5432/roads');
db.connect();

// http server
const express = require('express');
const app = express();

app.use(express.static(__dirname + '/public'));

// route
const layerName = 'pune_roads';
app.get(`/tiles/${layerName}/:z/:x/:y.mvt`, async (req, res) => {
  const bbox = mercator.bbox(req.params.x, req.params.y, req.params.z, false);
  const query = `
      SELECT ST_AsMVT(q, '${layerName}', 4096, 'geom') FROM (
        SELECT
          id, name, highway,
          ST_AsMVTGeom(
            wkb_geometry,
            ST_MakeEnvelope(${bbox[0]}, ${bbox[1]}, ${bbox[2]}, ${bbox[3]}, 4326),
            4096,
            256,
            true
          ) geom FROM pune_roads WHERE highway IS NOT NULL
        ) q
    `;
  try {
    const tiles = await db.query(query);
    const tile = tiles.rows[0];
    res.setHeader('Content-Type', 'application/x-protobuf');
    if (tile.st_asmvt.length === 0) {
      res.status(204);
    }
    res.send(tile.st_asmvt);
  } catch (err) {
    res.status(404).send({ error: err.toString() });
  }
});

app.listen(8080);
4. Add the new vector layer
Let’s add the tile layer to the map. We used mapbox [4] which is our web map of choice because of it’s performance, data-sets and robustness when it comes to configuring and styling the map.
Add the layer to map with this snippet:
map.addLayer({
  "id": "road",
  "source-layer": "pune_roads",
  "source": {
    "type": "vector",
    "tiles": ["http://localhost:8080/tiles/pune_roads/{z}/{x}/{y}.mvt"],
    "tolerance": 0,
  },
  "type": "line",
  "paint": {
    "line-color": "orangered",
    "line-width": ['step', ['zoom'], 0.4, 14, 1, 16, 2, 18, 4, 20, 8]
  }
});
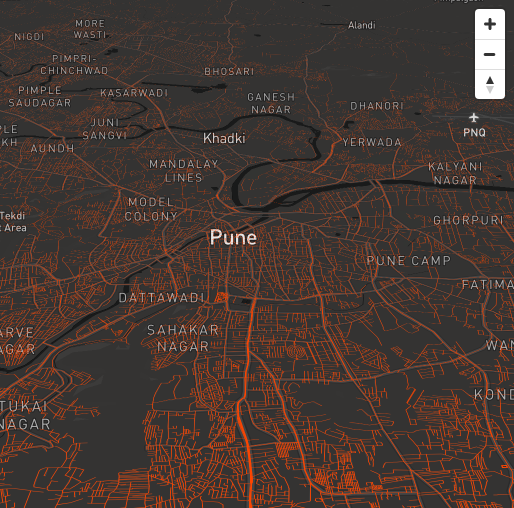
At this point, you should be able to see road data being rendered on the map.
Next steps to work on and explore:
- Cache tiles for sometime, say an hour, instead of re-generating again
- Allow pre-seeding and invalidation of cached tiles
You can find the entire source code, with caching, here at: https://github.com/androidfanatic/tiles_with_st_asmvt
References:
[1] Road data source: https://overpass-turbo.eu/
[2] https://medium.com/nycplanninglabs/using-the-new-mvt-function-in-postgis-75f8addc1d68
[3] https://docs.mapbox.com/mapbox-gl-js/example/data-driven-circle-colors/